



Soil is a complex biotope that can be classified into various types, including loam, chalk, peat, silt, clay, and sand, based on several parameters such as grain size. Sandy soils are often referred to as light soils due to their high sand content and low clay (Serawat et al., 2020). Soil particle fractions of different sizes harbor microbial communities that vary in structure, functional potentials, and sensitivity to environmental conditions (Hemkemeyer et al., 2018).
Microbial survival in both surface and underground water is influenced by numerous factors. Optimal conditions for survival are crucial for the effective introduction of bacteria into the soil. Previous studies have investigated the role of soil in the transfer of bacteria and pollutants from the surface to groundwater. The retention of microorganisms in soil contributes to the natural purification of groundwater, primarily through the adhesion of bacteria to soil particle surfaces (Yee et al., 2000; Fowle and Fein, 2000). This retention is a reversible process that begins within the first 45 minutes following the contact between cells and soil particles (Nola et al., 2005, 2006, 2010). It depends on several factors, some related to the bacterial cell - such as motility and surface properties - and others related to the environment, including pH, ionic strength, and the minerals dissolved in interstitial water, as well as the properties of soil particles (Nola et al., 2006; Yeeet al., 2000; Fowle and Fein, 2000). Bacterial migration in soil is also influenced by the compatibility between bacterial cell size and pore throat size, as well as inter-particle forces (Lai et al., 2025; De Jong et al., 2010). The impact of particle size on the migration and retention of bacterial cells in sand, along with its bio-mineralization, has also been noted (Lai et al., 2025; Wu et al., 2019; Stevik et al., 2004).
Soil pH plays a crucial role in bacterial diversity and stability, likely due to the variability in enzyme diversity and metabolic pathways among different bacterial species, as well as their ability to respond to changes in environmental conditions. However, this relationship can be influenced by other environmental factors such as precipitation, oxygen levels, and primary nutrients like nitrogen (N) and phosphorus (P) (Cho et al., 2016). Additionally, Breugem et al. (2024) noted that while pH has direct effects on microbial indicators, most influences are indirect, stemming from pH's impact on chemical inputs and soil indicators. These indirect effects subsequently shape the microbial community and its activity. Furthermore, Breugem et al.(2024) highlighted that microbial activity can alter soil pH, creating feedback loops between pH levels and decomposition rates. The effects of pH on microbial communities and the underlying mechanisms can vary, and changes in soil pH within a single soil type can significantly impact microbial biomass and activity (Breugem et al., 2024).
Many bacterial species inhabit contaminated surface waters that seep into the ground and subsequently into groundwater. One notable species is Escherichia coli, a normally commensal bacterium whose absence in an environment often indicates good hygienic and microbiological quality (WHO, 2023). In humans, E. coli is categorized into various pathotypes based on specific virulence factors, infection mechanisms, tissue tropism, interactions with host cells, and clinical symptoms (Pokharel et al., 2023). The pathotypes include Enteropathogenic E. coli, Enterohemorrhagic E. coli, Enterotoxigenic E. coli, Enteroaggregative E. coli, Diffusely Adherent E. coli, Enteroinvasive E. coli, Adherent-Invasive E. coli, Uropathogenic E. coli, Neonatal Meningitis E. coli, Septicemia-associated E. coli, and Avian Pathogenic E. coli (Pokharel et al., 2023; WHO, 2023; Geurtsen et al., 2022).
Water is the most essential element for human survival and well-being, making effective filtration crucial for maintaining its quality. Among various filtration methods, sand filtration stands out as one of the oldest and most reliable techniques. Sand filters operate by passing water through multiple layers of sand with varying grain sizes, which effectively remove impurities. Under natural conditions, these impurities are retained during the transfer of bacteria-contaminated water from the soil surface to the underground water table. Additionally, modeling contaminant transfer and retention in seepage water often considers variations in pollutant concentrations, qualities, sizes, or those of the materials involved (Bai et al., 2024; Sepehrnia et al., 2024; Zhu et al., 2024).
In addition, bacterial retention on solid surfaces depends not only on the properties of the cell surface but also on bacterial shape, which is influenced by the pH of the surrounding environment (Zhou et al., 2024). E. coli possesses peritrichous flagella, which are microstructures formed from self-assembling protein nanofibers. These flagella exhibit diverse morphologies that vary according to environmental factors such as ionic strength and pH. The morphologies and surface features of flagella can be easily tuned by adjusting the environmental pH (Li et al., 2012). Environmental pH affects the protein nanofibers in flagella structure, thereby influencing bacterial mobility (Su-Arcaro et al., 2023; Li et al., 2012).
Few studies have focused on the combination of parameters affecting water quality. The physicochemical and microbiological quality of water that has passed through a column of support materials results from a combination of several factors. For instance, the water pH and the size of the sand may interact during the transfer of bacteria through the soil. This raises important questions. What is the impact of varying the pH of infiltration water on the transfer and retention of bacteria-contaminants in homogeneous sandy soil? Similarly, how do variations in the properties of sandy material affect the transfer and retention of bacteria-contaminants in infiltration water? Understanding this information would help us better predict the fate of bacteria-contaminants in the environment. This study aims to assess the potential role of water pH and natural sand grain size on the retention of E. coli cells, which are significant due to their health implications and their role in indicating the microbiological quality of water and the environment, during the percolation of bacteria-contaminated water through a sand column.
2. Materials and methods
2.1 Ethical approval statement
No ethical approval was required for this study.
2.2 Sand collection site and period
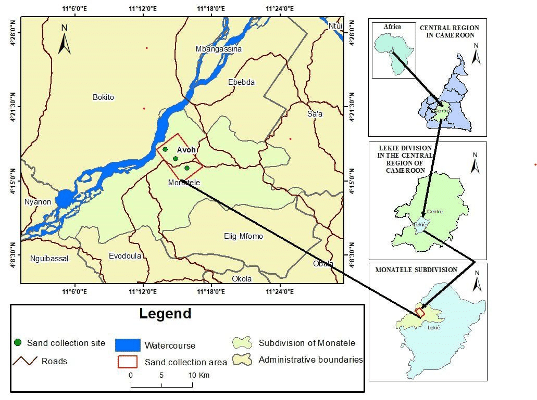
Sandy soils are defined as those with particle sizes ranging from 0.063 mm to 2 mm (Serawat et al., 2020). The sand samples were collected from a locality named Avoh in the Monatele subdivision of Cameroon, Central Africa (Figure 1). The map of the sand collection site was created using ArcGIS 10.5 software. The climate is typically equatorial, characterized by four unequal seasons (Succhel, 1972): a mild rainy season from April to June, a mild dry season from July to August, a peak rainy season from September to November, and a peak dry season from December to March of the following year.
In Avoh, there are three shallow sandy wells, and the land is privately owned by families. Sand extraction is not subject to any specific municipal regulations but only requires the consent of the landowners. Sand was collected in August 2024 and dried at laboratory temperature (25±2 °C) for one month.
2.3 Determining different sand grain sizes
Experiments were conducted from October to December 2024. The dried sand was sieved four times using mesh sizes of 0.8 mm, 0.5 mm, 0.3 mm, and 0.1 mm in succession to obtain three distinct size ranges. Range 1 contains sand with grain sizes from 0.1 to 0.3 mm, Range 2 contains sand with grain sizes from 0.3 to 0.5 mm, and Range 3 contains sand with grain sizes from 0.5 to 0.8 mm. The three sand ranges obtained from the sieving were washed with sterile distilled water and dried at room temperature.
2.4 Isolation, identification of E. coli, and strain cryopreservation
The bacteria E. coli were isolated from wells in Yaoundé using Endo agar culture medium (Difco) and the filter membrane method, following a 24-hours incubation at 44 °C. Identification was performed using standard biochemical methods (Holt et al., 2000). Subsequently, cells were harvested by centrifugation at 8000 rpm for 10 minutes at 10 °C and washed twice with a physiological solution (8.5 g/l NaCl). The pellet was re-suspended in the physiological solution and then transferred to 300 μl tubes. The stocks were stored in glycerol vials in a freezer (Rodier et al., 2009; Holt et al., 2000).
2.5 Experimental design
The experimental protocol was adapted and modified from the works of Mohammed and Solumon (2022), Mahmood et al. (2024), and Sajidan et al.(2024). In this study, three groups of non-biological materials were used: sand of varying sizes, 30 polyvinyl chloride (PVC) pipe fragments measuring 1050 mm in length and 33 mm in internal diameter, and 30 Erlenmeyer flasks, each with a capacity of 2 liters and a tap fitted to the base.
One thousand milliliters of sterile physiological saline solution was added to each Erlenmeyer flask, which were then grouped into five series: A, B, C, D, and E, with each series containing six identical flasks. The contents of the Erlenmeyer flasks in series A, B, C, D, and E were adjusted to pH levels of 5, 6, 7, 8, and 9, respectively. The entire setup was then sterilized in an autoclave, and a sterile infuser was connected to the tap of each Erlenmeyer flask.
The interior of each of the 30 pipe fragments was washed with chloride-disinfected water, rinsed with sterile physiological water, and then dried at laboratory temperature. These pipes were grouped into five series: A, B, C, D, and E, with each series containing six identical pipe fragments. The pipes in series A, B, C, D, and E were designated for experiments using water with pH values adjusted to 5, 6, 7, 8, and 9, respectively. Each series of six pipes was further classified into three duplicate groups, named I, II, and III.
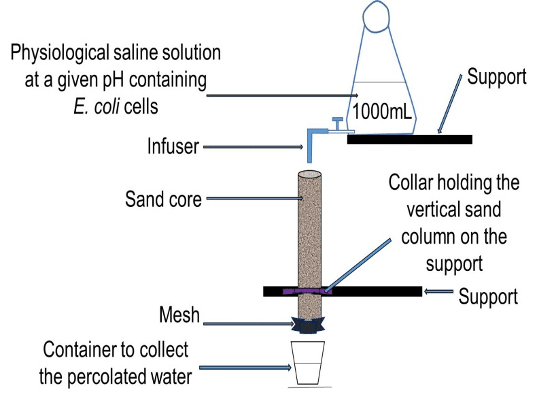
Sand grains of a specific size were introduced into the pipes to a height of 1000 mm. Each size range of sand grains was added to duplicates of pipe fragments from each of the three groups. The bottom of each pipe containing sand was double-wrapped with sterilized wire mesh, with a mesh size of less than 0.1 mm. These pipe fragments, arranged in series and in duplicates, were then placed on supports in the laboratory. A sterile container was positioned below each pipe to collect the water that would percolate through. Figure 2 illustrates the experimental setup, showing a pipe on its support and the corresponding Erlenmeyer flask placed on the shelf.
2.6 Inoculation in physiological saline solution and percolation tests
Prior to the experiments, stocks of frozen vials containing E. coli cells were thawed at room temperature. Next, 100 µl of the culture was transferred into test tubes containing 10 ml of nutrient broth (Oxford) and incubated at 37 °C for 24 hours. The cells were then harvested by centrifugation at 8000 rpm for 10 minutes at 10 °C and washed twice with sterile NaCl solution (8.5 g/l). The pellets were re-suspended in 50 ml of sterile NaCl solution (8.5 g/l). After homogenization, the concentration of bacterial cells was adjusted to 7 × 10¹⁰ CFU/ml by measuring the optical density at 600 nm using a spectrophotometer, followed by culturing on standard agar medium (Mira et al., 2022). One milliliter of the suspension was then added to 1000 ml of sterile NaCl solution (8.5 g/l) in an Erlenmeyer flask, and the mixture was homogenized. Consequently, the cell concentration in the 1000 ml Erlenmeyer flask solution was 7 × 10⁷ CFU/ml.
The tap was adjusted to a flow rate of 2 ml per minute, allowing the bacteria-contaminated water to flow above the sand column. This protocol was adapted and modified from the methods of Mohammed and Solumon (2022), Zhu et al. (2024), and Mahmood et al. (2024). The moment the first drops of percolated water were collected was designated as T0, and these initial drops were analyzed. Subsequently, the percolated water drops were collected in 2-hours increments and analyzed. Bacteriological analysis of the percolated water was conducted on the first drops, as well as on water collected after 2, 4, 6, and 8 hours. This analysis was performed on Endo agar culture medium (Difco), using the plate count method. Petri dishes were incubated at 44 °C for 24 hours, and the results were expressed in CFU/ml.
2.7 Statistical analysis
The mean cell concentration in percolated water for each duplicate was calculated and illustrated using histograms. The relationships among some of the considered parameters were assessed using the Spearman correlation test and the Kruskal-Wallis test. The percentage of cells retained (CR) in 1 ml of water percolated through the sand column for each experimental condition was calculated according to Gross et al. (1995).
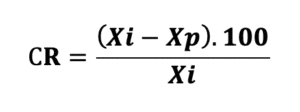 In this formula, Xi represents the cell abundance in 1 mL of water collected above the column of sand, while Xp indicates the cell abundance in 1 mL of percolated water. This data analysis was conducted using Excel 2010 and SPSS 20.0 software.
3. Result
3.1 Cell abundances in water percolated
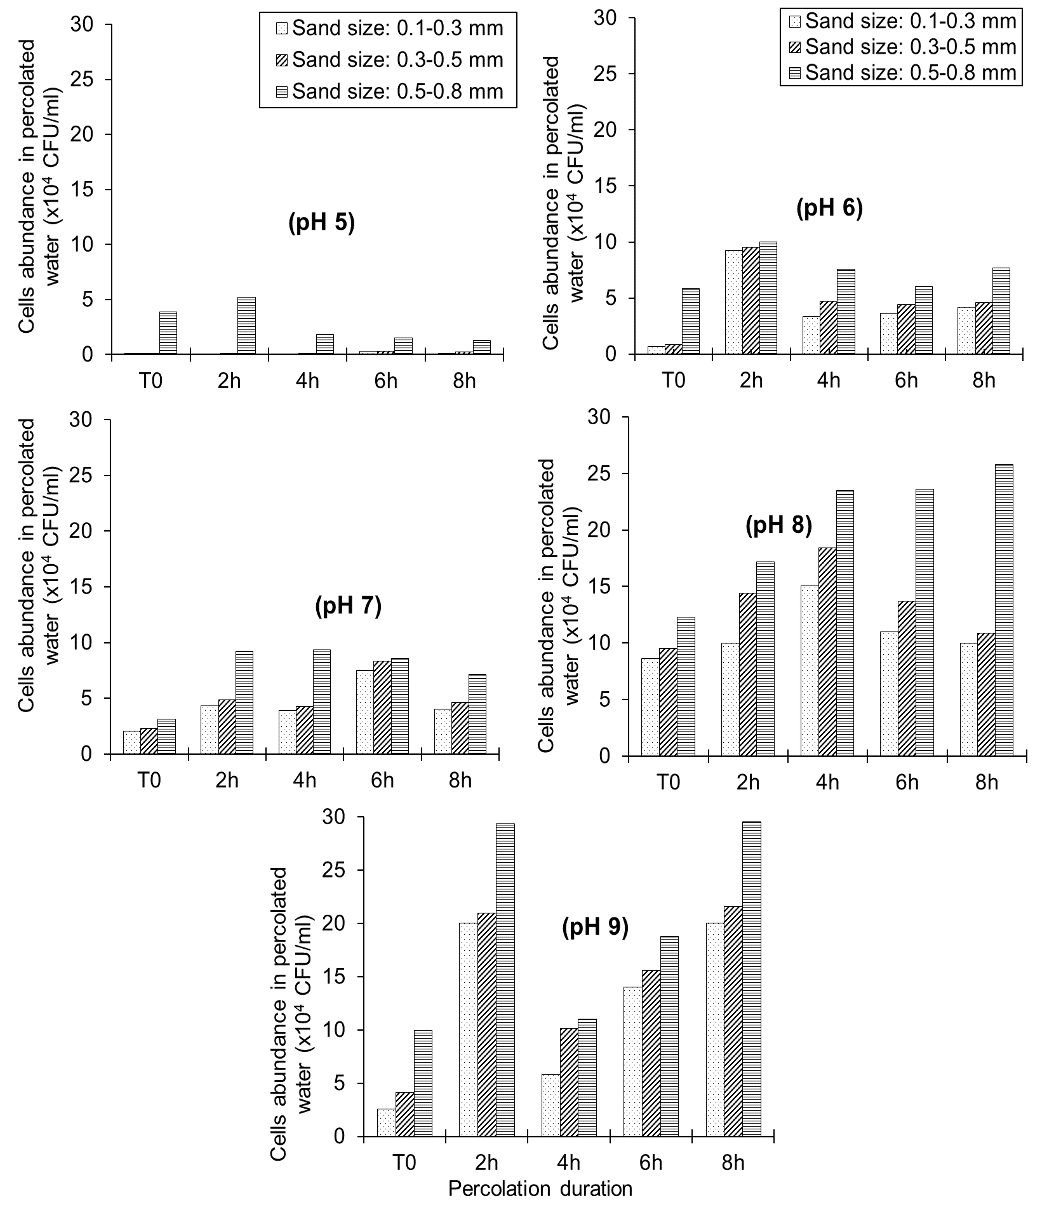
The mean cell concentration in percolated water for each duplicate was calculated and illustrated using histograms. The scale was standardized across all graphs to enhance the comparative visualization of cell abundances among the pH levels of bacteria-contaminated waters (Figure 3). Cell concentrations fluctuated between 0.036×10⁴ and 29.5×10⁴ CFU/ml. The lowest value was recorded at 4 hours of percolation with water contaminated at pH 5, while the highest abundance was observed at 8 hours of percolation with water contaminated at pH 9. Overall, the number of cells in percolated water increased with rising pH levels and appeared to increase with larger sand grain sizes (Figure 3).
3.2 Cells retained percentages (CR)
The percentages of cells retained (CR) in 1 ml of water that percolated through the sand column for each experimental condition have been calculated. The results are presented in Table I. It is evident that the CR percentage varies significantly from one water pH to another. The highest values are predominantly recorded at a water pH of 5, while the lowest are observed with alkaline water (Table 1). Additionally, the highest values generally occur at the beginning of the process (T0) (Table 1). However, variations in the collection periods of the percolated water appear to be random, with some periods showing an increase and others a decrease (Table 1).
For sand grain sizes of 0.1-0.3 mm, CR varied from 99.99% to 99.71%, with the lowest value recorded at a water pH of 9 after 2 and 8 hours of percolation. For sand grain sizes of 0.3-0.5 mm, CR ranged from 99.99% to 99.70%, with the lowest value noted after 2 hours of percolation. For sand grain sizes of 0.5-0.8 mm, CR varied from 99.99% to 99.57%, with the lowest value recorded after 8 hours of percolation (Table 1).
Table 1. Cells retained (CR) percentage per ml of water percolated through the sand column for each of the collecting period.
3.3 Correlations between some considered parameters
The correlation coefficients between cell abundances in percolated water and water pH indicated a significant positive correlation between the two parameters (P < 0.05) (Table 2).
Table 2. Correlation coefficients between E. coli cell abundances in percolated water and pH for each percolated water collection period.
Correlation coefficients between E. coli cell abundances in percolated water and sand grain sizes were calculated for each percolated water collection period. The results indicated that cell abundance in the percolated water is significantly and positively correlated with sand grain size at T0 (in the initial drops of percolated water) and after 8 hours of percolation (P<0.05) (Table 3). No significant correlation was observed during other percolated water collection periods (P >0.05).
Table 3. Correlation coefficients between E. coli cell abundances in percolated water and sand size for each percolated water collection period.
3.4 Comparison amongst cell abundances and effect of pH and sand size ranges
The comparison of cell abundances in percolated water showed significant variation across different pH values for each of the three sand grain size ranges, considering all percolated water collection periods (P < 0.05) (Table 4).
Table 4. P value of the Kruskal-Wallis comparison test amongst cell abundances in percolated water when considering water pHs values and all percolated water collection periods for each of the sand size range.
Considering all three ranges of sand grain sizes and the five periods of percolated water collection, this test demonstrated that significant variation in cell abundances in the percolated water occurs only at a water pH of 8 (P < 0.05) (Table 5).
Table 5. P value of the Kruskal-Wallis comparison test amongst cell abundances in percolated water when considering water pHs values and all percolated water collection periods for each of the sand size range.
3.5 Comparison amongst cell abundances and effect of the percolated water collection periods
The comparison of bacterial concentrations in percolated water was conducted across all ranges of sand grain sizes and pH values of the introduced water for each of the five collection periods. Notably, except for the initial collection period (T0) of the first drops, there is a significant variation in the abundance of E. coli in the water percolated during the collection periods of 2h, 4h, 6h, and 8h (P<0.05) (Table 6).
Table 6. P value of the Kruskal-Wallis comparison test amongst cells abundances in percolated water when considering all the 3 sand size ranges and all water percolates pH, for each of the 5 collection periods of the percolated water.
4. Discussion
A decrease in cell concentration was observed in the percolated water compared to the water introduced into the sand column, indicating the retention of bacteria-contaminants within the sand columns. Cell numbers in percolated water were generally low at pH 5, but increased as the pH of the bacteria-contaminated water percolating through the sand columns rose. This suggests that the low pH of the infiltration water favored the retention of E. colicells on the surfaces of the sand grains. The pH of the surrounding environment influences the surface charge of microorganisms and solid particles by altering the ionization balances (protonation/deprotonation) of exposed functional groups. Such modifications can lead to either a reduction or an increase in repulsive electrostatic interactions, affecting cell adhesion (Samandoulgou et al., 2015). At higher pH levels, the repulsive forces increase due to changes in the charge of mineral and organic surfaces, resulting in decreased particle deposition (Chen et al., 2011). Additionally, lower pH in bacterial solutions has been associated with greater ion generation and a longer bioflocculation lag period (Lai et al., 2023). Florent et al. (2022) also identified pH as a key factor influencing the distribution of DNA bacteriophages and bacterial populations in soil.
Adhesion of E. coli is often mediated by a specific interaction between an adhesin and its receptor on the surface of the adsorbent particle (Klinth et al., 2012). E. coli is a motile bacterium characterized by pili and peritrichous flagellation. The structure of the pilus and its biomechanical properties are crucial for the bacteria's ability to withstand external forces caused by liquid flow. In their study on the adhesion properties of piliated E. coli across a broad pH range, Klinth et al. (2012) observed that adhesion occurred throughout the entire physiologically relevant pH range (pH 4.5-8). They found that the binding rate peaked around pH 5, while binding stability exhibited a broader distribution across pH levels. Hamadi et al. (2005), in their work on the adhesion of Staphylococcus aureus to glass, indicated that cells adhered strongly in the pH range of 4 to 6, but weakly at highly acidic (pH 2 and pH 3) and alkaline pH levels.
Additionally, it has been noted that cell abundance varies with changes in sand grain size. The size of the sand grains influences the transfer and retention of bacteria and contaminants present in water during infiltration. Some researchers have highlighted the importance of sand grain size in the retention of contaminants in percolating water. Small sand grains, less than 0.25 mm in diameter, effectively retain contaminants and inhibit their migration, while larger sand grains retain them with a delay (Lai et al., 2025; Tabatabaei et al., 2022).
When investigating the impact of bacterial cell properties and grain size on bacterial transport and deposition in porous media, Bai et al. (2016)observed that cell characteristics influenced bacterial transport behavior in fine sand. However, similar breakthrough patterns and retardation factors in coarse sand indicated that bacterial transport was more dependent on grain size than on bacterial cell properties. Additionally, they noted that retention decreased with increasing hydrophobicity and increased with higher electrophoretic mobility of bacteria. The larger sand grain size resulted in decreased bacterial retention, except for motile E. coli, suggesting that the retention of this strain was more influenced by cell motility than by sand grain size.
Some authors have indicated that ionic strength, the concentration of ions in percolating water, can also affect cell retention on solid particles. At higher ionic strengths, charge effects on the bacterial cell surface can enhance adherence by reducing the thickness of the diffuse double layer. At pH 5-6, as the hydrophobicity of minerals increases, bacterial cells with lower hydrophobicity and a high negative charge on their membrane surfaces are more attracted to the more hydrophobic surfaces (Zuki et al., 2022; Hwang et al., 2010). Sheng et al. (2008) studied the adhesion forces of two anaerobes (Desulfovibrio desulfuricans and Desulfovibrio singaporenus) and an aerobe (Pseudomonas sp.) to stainless steel across various aqueous systems. They found that the ionic strength of the solutions influenced the bacteria-metal interactions. The bacteria-metal adhesion force reached its peak when the pH of the solution was near the isoelectric point of the bacteria, specifically at the zero point charge.
The temporal variations in the concentration of cells in the percolated water and the CR percentages, for the same sand grain size range and pH value of the bacteria-contaminated water, have been noted. This indicates a reversibility in the cell retention process on the surface of sand grains in the columns. Other authors have suggested that this is a reversible process that begins within the first 45 minutes of contact between cells and soil particles (Nola et al., 2003, 2005). The interactions at the cell-mineral interface are complex and dynamic, governed by a variety of transient physicochemical interactions (Nola et al., 2011). Cai et al. (2020) indicated that variations in this process can be attributed to several dominant control factors. The intrinsic nature of the surfaces, which relates to double-layer properties and the number and nature of reactive surface sites, including defects, is included in those factors. The presence of organic or inorganic coatings on particle surfaces, which affect the intrinsic properties of the particle surface as well as the surface properties and reactive sites of the coatings, is also included. The chemical bonds between atoms and molecules and potential changes in their chemical coordination during sorption, including cation coordination number, valence state, and hydrolysis, as well as the mode and nature of adsorbate molecules bonding to the surface also controls the process. The influence of other complexants, which can lead to either desorption or enhanced adsorption, is also considered in this control (Cai et al., 2020).
According to Lai et al. (2025), bacterial migration in soil is primarily influenced by two factors. The first is the compatibility between bacterial cell size and pore throat size (bacterial cells can only pass freely through a pore throat that exceeds their size, with pore throat size mainly depending on soil properties). The second is the forces between particles which increase as the distance between particles decreases.
Additionally, bacterial cells can be retained in the soil through three mechanisms. The first is the self-adsorption of bacterial cells (where bacterial cells spontaneously adsorb onto the surface of soil particles, potentially due to the negative charge of the bacterial cell surface). The second is physical straining by the soil skeleton (considered a filtration system capable of “physically straining” bacterial cells injected into the soil, with this straining dependent on the relationship between bacterial cell size and pore throat size, increasing as pore throat size decreases). The last mechanism is the straining enhancement by attaching to a carrier (where bacterial cells are retained in the soil by attaching to carriers) (Lai et al., 2025; Cui et al., 2020; Ma et al., 2020).
Sand columns, used on a family scale as filters, help to reduce the concentration of pollutants in the water introduced into them. This process relies on several fundamental mechanisms to remove impurities. These mechanisms include the biological action of a biofilm layer composed of microorganisms that form around the sand particles, as well as adsorption, where chemical and physical interactions cause contaminants to adhere to the sand. Additionally, the sedimentation of suspended particles allows them to settle, and a straining phenomenon occurs. During straining, coarser particles are mechanically trapped by the sand grains, with the size of the trapped particles depending on the grain size and pore space between the sand particles (Boersma et al., 2025; Corbera-Rubio et al., 2024; Iron et al., 2022).
5. Conclusions
Water treatment through sand filtration is a complex process that relies on several factors for effectiveness. E. coli cells in acidic percolating water are retained more effectively in sand columns than those in alkaline water. This retention process appears to be more efficient with smaller sand grain sizes. The percentage of retained cells varies over time. The sand grains used in these experiments have not been stripped of potential biodegradable compounds nor sterilized, allowing for the possible intervention of bacteriophages associated with the grains. During the transfer of bacteria-contaminated water through a sand column at the household scale, as well as through sandy soil or subsoil in a natural environment, many complex interactions may occur. Field and laboratory experiments should continue to clarify the individual roles of various microbiological, physicochemical, and hydrological factors involved.
Acknowledgements
We thank the Department of Earth Sciences of the Faculty of Sciences, University of Yaoundé I, for its assist in sieving the sand.
Source of funding
This research was partially supported by the University of Yaoundé I through the supply of some laboratory ingredients, and partially by the authors.
Data availability
The data generated from this study have been analyzed and presented in the article.
Informed consent statement
No informed consent was required to conduct the study.
Conflict of interest
The authors declare no conflict of interest.
Authors’ contribution
Conceptualization: Geneviève Bricheux, Télesphore Sime-Ngando, and Moïse Nola; Data collection: Arnaud Kassing, Yves Poutoum Yogne, and Paul A. Nana; Data analysis: Arnaud Kassing, Yves Poutoum Yogne, and Paul A. Nana; Figure preparation: Arnaud Kassing and Moïse Nola; General supervision: Geneviève Bricheux, Télesphore Sime-Ngando, and Moïse Nola. All authors critically reviewed the manuscript and agreed to submit final version of the manuscript.
