


Isochrysis galbana is a brown marine haptophyte that is rich in polyunsaturated fatty acids (PUFAs) and has a diverse proximate composition, including protein, lipids, and carbohydrates, along with essential amino acids. It also contains a variety of pigments, with fucoxanthin as the primary pigment, alongside various antioxidants (Khaw et al., 2021; Natrah et al., 2007). Due to its exceptional nutritional profile and abundance of bioactive compounds, I. galbana has been widely utilized in various industries, including food, aquaculture, and pharmaceuticals. In recent years, phycologists have conducted numerous studies aimed at developing optimal culture methods to achieve high microalgal productivity. Manipulating key culture conditions such as nutrients, pH, salinity, temperature, light, and agitation is essential for creating favorable conditions that promote microalgal growth (Gatamaneni et al., 2018). Determining the optimal combination of these culture conditions is important, as each species strain exhibits varying preferences, characteristics, and chemical compositions (Khaw et al., 2022).
Agitation is essential in microalgal cultivation. Achieving an optimal level of agitation is crucial for maximizing culture productivity and sustaining high algal biomass production. The homogeneity of the cell culture depends on the effectiveness of the agitation system used. There are three primary agitation systems: mechanical, pneumatic, and hydraulic. Mechanical agitation utilizes an object, typically a blade, to stir the culture. Pneumatic agitation employs aeration to mix the cell suspension, while hydraulic agitation uses a hydraulic pump to circulate the suspension (Brusselman et al., 2010). However, agitation has been found to incur significant costs in electrical energy consumption (Slade and Bauen, 2013). Since cost is a major obstacle in the commercialization of microalgae and sedimentation takes time, it is crucial to gain more insights into the impact of agitation on the physiological properties of microalgae.
Although agitation is a crucial factor in microalgal cultivation, only a limited number of studies have examined its effects on microalgae. For instance, Sobczuk et al. (2006) investigated the impact of mechanical agitation speed on Phaeodactylum tricornutum and Porphyridium cruentum. They found that agitation speeds exceeding 350 rpm and 550 rpm caused damage to P. tricornutum and P. cruentum, respectively. In another study, Ronda et al. (2012)explored the effect of aeration speed on the growth and gamma-linolenic acid (GLA) production of Spirulina platensis. They discovered that increasing the aeration rate from 0.2 to 2.5 vvm enhanced both the specific growth rate and GLA content when employing periodic sparging. Subsequently, Gómez-Loredo et al. (2016) examined the effects of two different mixing conditions—1 vvm aeration and 130 rpm agitation—on cellular growth and fucoxanthin production in P. tricornutum and I. galbana. Their results indicated that aeration promoted cellular growth and increased fucoxanthin yield in both microalgae. Recently, Amzah et al. (2023) analyzed the growth and fatty acid composition of Acutodesmus obliquus Q2-12E under three different agitation methods: (1) molecular diffusion, (2) shaking at 140 rpm, and (3) aeration. Their findings revealed that aeration significantly improved the specific growth rate and PUFA content of the microalga. Agitation frequency is a crucial parameter in determining the success of microalgal cultures, as some microalgae are sensitive to shear stress produced by agitation, while biomass sedimentation can lead to decreased productivity. However, no studies have investigated the physiological properties of microalgae under different agitation frequencies. Therefore, this study aims to examine the impact of four different agitation frequencies on the physiological properties of I. galbana. The findings could contribute to optimizing microalgal cultivation methods and enhancing the commercial viability of microalgae.
2. Materials and Methods
2.1 Ethics declarations
Not applicable.
2.2 Microalgal strain
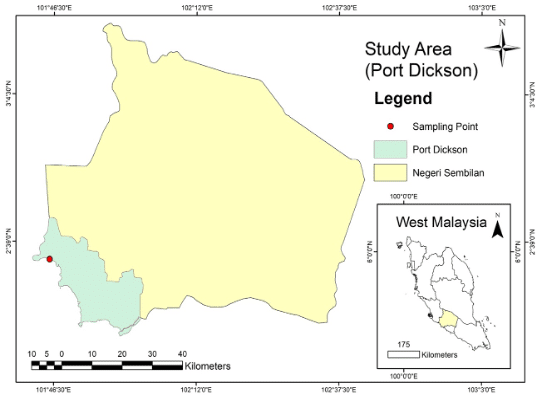
The microalgal strain used in this study was originally isolated from the coastal waters of Port Dickson (Figure 1), located on the west coast of Malaysia (2°27’57.786’’N, 10°50’54.336’’E) and has been maintained in the Aquatic Health and Therapeutics Laboratory at the Institute of Bioscience, Universiti Putra Malaysia. This microalga, designated UPMC-A0083, was identified as I. galbana in a previous study (Khaw et al., 2020). The species of the microalga was confirmed using both morphological and molecular approaches.
2.3 Microalgal maintenance
The microalga was maintained in the Laboratory of General Research, Department of Aquaculture, Faculty of Agriculture, Universiti Putra Malaysia. It was cultivated in a 30 ppt Conway medium with the following final concentrations (grams per liter): 100 KNO3, 20 Na3PO4, 49.82 Na2H2EDTA.2H2O, 1.3 FeCl3.6H2O, 2.1 ZnCl2, 0.36 MnCl2.4H2O, 2 CoCl2.6H2O, 2 CuSO4.5H2O, 0.9 (NH4)6Mo7O24.4H2O, 33.4 H3BO3, 0.2 thiamin-HCl and 0.01 cyanocobalamin. The culture was grown in a 250 mL flask at 25 °C under LED light with continuous orbital shaking. It was then scaled up to a 1.2 L bubble column reactor (BCR), with a gradual increase in temperature to 30 ± 1 °C and light intensity to 400 µmol photons/m²/s, following a photoperiod of 18:6 hours (light: dark cycle). The culture was continuously agitated by aerating ambient air through 0.2 μm filters (Millipore) at a flow rate of 0.5 L/min.
2.4 Experimental design
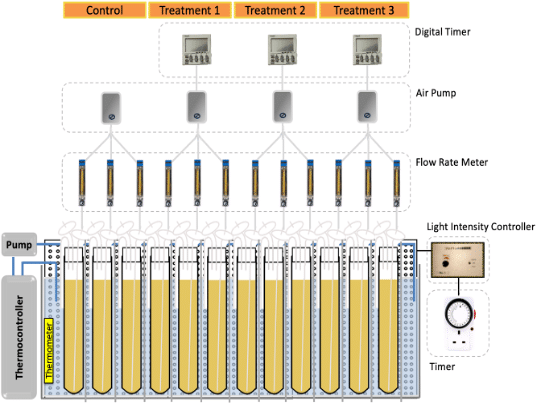
I. galbana was grown in batch culture mode under four different agitation frequencies: treatment 1 (1/1), treatment 2 (1/10), treatment 3 (1/20), and treatment 4 (1/30 minute of agitation per minute of operation). Before starting the experiment, an inoculum was prepared using the same culture setup as the experimental conditions (Figure 2). It was allowed to acclimatize gradually over three batches to ensure stable growth. The inoculum at the exponential phase of the third batch was then transferred into 12 identical sterilized BCRs. LEDs were installed vertically behind the cultures to ensure equal light exposure. Light intensity, photoperiod, and agitation frequency were adjusted using light intensity controllers, timers, and digital timers (H5CZ-L8E, OMRON, Japan), respectively. All treatments were maintained under the same culture conditions, with a working volume of 1.2 L.
2.5 Growth assessment
The growth of I. galbana was evaluated every two days over a period of 30 days through cell enumeration and biomass determination. Cell enumeration involved directly counting the cells using a hemocytometer. One mL of the homogeneous culture was mixed with a drop of Lugol’s solution and counted under a DM 2500 Leica microscope at 60× magnification. For biomass determination, a volume of the cell suspension was filtered through a combusted glass fiber filter (GF/A, Whatman, UK). The filter was then washed three times with 0.5 M ammonium formate to remove soluble salts. Subsequently, it was dried at 60 °C for three hours and allowed to cool to room temperature in a desiccator before weighing. Growth parameters were determined using the following formula,

2.6 Photosynthetic efficiency (Fv/Fm)
Maximum photosynthetic efficiency (Fv/Fm) was measured under actinic light using the AquaPen (AP 110-C, AquaPen-C, Japan). Four mL of cell suspension were kept in the dark for 30 minutes at 25 °C before being promptly transferred into a 15 mm diameter quartz cuvette. Once stable maximum fluorescence in the dark-adapted state (Fo) was reached, a saturating pulse (1,200 μmol photons/m²/s, 655 nm, 0.8 s) was applied to determine the maximum fluorescence (Fm) after dark acclimation. The photosynthetic efficiency of PS II was calculated using the equation from the study by Schreiber et al. (1986).

2.7 Nutrient uptake
Cell suspension was filtered and diluted with sterilized milli-Q water at a 1:9 ratio. Stock standards were prepared by dissolving the following in milli-Q to make 1 L: 0.722 g KNO3, 0.492 g NaNO2, and 0.439 g KH2PO4. These were then mixed in a ratio of 14:2:3 (mL) respectively and made up to 100 mL using milli-Q to produce Standard A (A-STD). Calibrants (CAL) were prepared at six different concentrations to create a linear graph for in-machine correlation of absorbance to nutrient concentration. The calibrants were prepared by diluting A-STD with milli-Q at the following ratios: 5:0 (CAL1), 4:1 (CAL2), 3:2 (CAL3), 2:3 (CAL4), 1:4 (CAL5), and 0:5 (CAL6). The calibrants and samples were then analyzed using the AutoAnalyzer (QuAAtro 39 Continuous Segmented Flow Analyzer, SEAL Analytical, UK), which comprises two channels (CH1: NO2- + NO3-; CH2: NO2-, PO43-), following Armstrong’s (1967) method. Analysis on CH1 was conducted with a coated cadmium coil installed for the reduction of NO3- to NO2-, and absorbance was measured at 520 nm. The NO3- content was determined by subtracting the NO2- concentration (CH2) from the combined NO2- + NO3- concentration (CH1).
2.8 Cell size
The cell suspension was mixed with Lugol’s solution prior to examining cell size. The cells were observed under a DM 2500 LED Leica microscope equipped with a microscopic eyepiece camera (AM7025X Dino-Eye Edge, Dunwell Tech, US). The size of at least 70 microalgal cells was measured using DinoCapture 2.0 imaging software, with the measurement scale calibrated before each analysis.
2.9 Statistical analysis
All data were analyzed using one-way ANOVA to assess significant differences at the 5% significance level (α = 0.05). A post-hoc analysis with the Tukey test (P < 0.05) was conducted to identify significant differences between treatments. The statistical software RStudio (PBC, Version 1.4.1106) was used for the analysis. Data are presented as mean ± standard error of the mean (SEM) from three replicates (n = 3).
3. Result
3.1 Isochrysis galbana yielded best growth performance at 1/1 moa/moo
A similar pattern in the growth curves of I. galbana based on cell density and biomass was observed across different agitation frequencies (1/1, 1/10, 1/20, 1/30 moa/moo) (Figure 3). An increasing trend in both cell density and biomass was identified at each agitation frequency. Agitation of this microalga at 1/1 moa/moo was the only frequency that demonstrated a complete growth cycle, encompassing the lag, exponential, stationary, and decline phases. All agitation frequencies exhibited the lag phase from the initial day to the second day. A pronounced exponential phase was detected with agitation at 1/1 moa/moo, in comparison to the other frequencies. Moreover, the growth of this microalga increased rapidly, nearly doubling in both cell density and biomass from the second day to the eighth day under agitation at 1/1 moa/moo, a condition not observed at the other agitation frequencies. The other frequencies (1/10, 1/20, 1/30 moa/moo) showed slower growth, even during the exponential phase. Furthermore, the maximum growth of this microalga, in terms of cell number (14.99 ± 0.04 x 10⁶ cells/mL) and biomass (0.62 ± 0.00 g/L), was achieved on the 18th day under agitation at 1/1 moa/moo. On the same day, the lowest growth, in terms of cell number (2.95 ± 0.22 x 10⁶ cells/mL) and biomass (0.12 ± 0.01 g/L), was observed under agitation at 1/30 moa/moo. I. galbana under agitation at 1/1 moa/moo reached the stationary phase earlier than those subjected to the other agitation frequencies.
I. galbana exhibited the best growth performance at an agitation frequency of 1/1 moa/moo, surpassing all other tested frequencies (Table 1). This frequency resulted in significantly higher growth (P < 0.05) in terms of both cell density (14.04± 1.56 × 10⁶ cells/mL) and biomass (0.58 ± 0.06 g/L) on day 30, compared to other agitation frequencies. In contrast, the lowest cell density (3.15 ± 0.25 × 10⁶ cells/mL) and biomass (0.13 ± 0.01 g/L) for this microalga at day 30 were recorded at an agitation frequency of 1/30 moa/moo, showing no significant difference (P > 0.05) compared to the 1/10 and 1/20 moa/moo frequencies.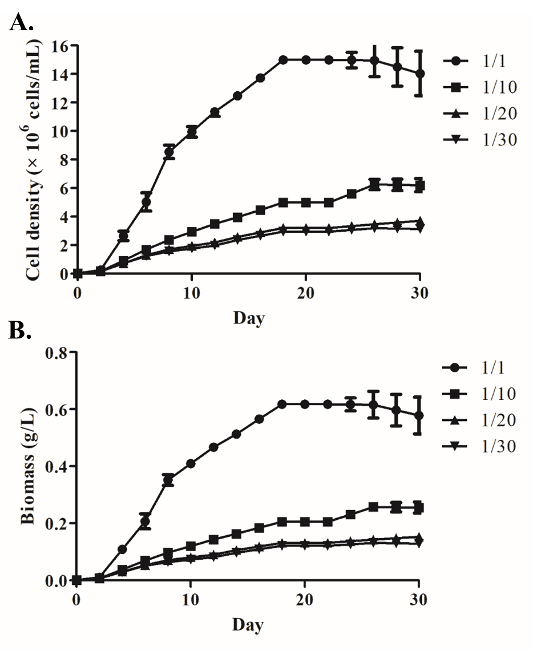
For maximum cell density and biomass, I. galbana achieved the highest values at the 1/1 moa/moo agitation frequency within the shortest culture period (18 days), demonstrating a significant difference (P < 0.05) compared to other frequencies. Conversely, agitation frequencies with larger intervals (1/20 and 1/30) resulted in at least a 4.7-fold lower maximum cell density (3.19 ± 0.25 × 10⁶ to 3.72 ± 0.28 × 10⁶ cells/mL) and biomass (0.13 ± 0.01 to 0.15 ± 0.01 g/L) over longer culture periods (26 and 30 days) compared to the 1/1 moa/moo frequency.
The highest biomass productivity (34.22 ± 0.12 mg/L/day) and specific growth rate (SGR) (0.58 ± 0.00 /day) for this microalga were achieved at an agitation frequency of 1/1 moa/moo, showing a significant difference (P < 0.05) from other frequencies. In contrast, agitation frequencies of 1/20 and 1/30 resulted in the lowest biomass productivity (5.01 ± 0.40 to 5.07 ± 0.40 mg/L/day) and SGR (0.17 ± 0.01 to 0.18 ± 0.00 /day) for this microalga.
Table 1. Growth of Isochrysis galbana at different agitation frequencies.
3.2 Highest photosynthetic efficiency yielded at the beginning of culture whilst lowest at the end under 1/1 moa/moo agitation
I. galbana cultured under four different agitation frequencies (1/1, 1/10, 1/20, and 1/30 moa/moo) exhibited varying patterns of photosynthetic efficiency (PE) (Fv/Fm) on both day 6 and day 30 (Figure 4). On day 6, both cell density and PE of I. galbana decreased as the intervals between agitation frequencies increased. The highest PE (0.61 ± 0.01) was observed under continuous agitation (1/1 moa/moo), which is significantly higher (P < 0.05) than the values recorded at the other agitation frequencies. Agitation at frequencies of 1/10, 1/20, and 1/30 moa/moo resulted in the same lowest PE value of 0.53 ± 0.00.
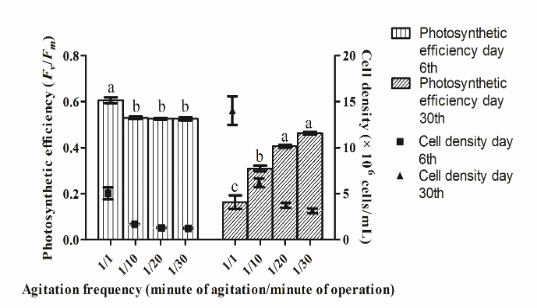
At day 30, the photosynthetic efficiency (PE) of this microalga exhibited a direct relationship with the magnitude of the gap in agitation frequency. Conversely, an inverse relationship was observed between PE and cell density. The highest PE (0.46 ± 0.01) was achieved at an agitation frequency of 1/30 moa/moo, showing no significant difference (P > 0.05) compared to 1/20 moa/moo (0.41 ± 0.01). Agitation at 1/1 moa/moo resulted in the lowest PE value (0.17 ± 0.03), which was significantly different (P < 0.05) from other agitation frequencies.
Overall, PE of this microalga decreased over time. The PE under 1/1 moa/moo on day 6 (0.61 ± 0.01) was significantly higher (P < 0.05) than on day 30 (0.17 ± 0.03). For intermittent agitation frequencies (1/10, 1/20, 1/30 moa/moo), the PE values were significantly lower (P < 0.05) on day 30 compared to day 6.
3.3 Agitation at 1/10 moa/moo assimilated highest nitrate and phosphate
The nitrate (NO3-) uptake by I. galbana is at least 4.5 times higher than the phosphate (PO43-) uptake, regardless of agitation frequency (Figure 5a). The highest NO3- uptake observed was 16.76 ± 0.01 mg/L at an agitation frequency of 1/10 moa/moo, showing no significant difference (P > 0.05) compared to 1/1 moa/moo (16.70 ± 0.08 mg/L). However, this value was significantly different (P < 0.05) from the other agitation frequencies (1/20 and 1/30 moa/moo). Agitation at 1/20 and 1/30 moa/moo resulted in the lowest NO3- uptake, with 11.95 ± 0.43 mg/L and 11.03 ± 0.34 mg/L, respectively. In terms of nutrient utilization percentage, NO3- uptake ranged from 65.50% to 99.51% (Figure 5b). Agitation at 1/1 (99.16 ± 0.49%) and 1/10 (99.51 ± 0.05%) moa/moo nearly absorbed all available NO3- in the media. In contrast, only 65.49 ± 2.03% and 70.98 ± 2.56% of NO3- were taken up at agitation frequencies of 1/20 and 1/30 moa/moo, respectively. The pattern of significant differences corresponded to the amount of NO3- uptake.
I. galbana agitated at 1/10 moa/moo exhibited the highest PO43- uptake (2.49 ± 0.00 mg/L), showing a significant difference (P < 0.05) compared to other agitation frequencies (1/1, 1/20, and 1/30 moa/moo) (Figure 5a). This was followed by the agitation frequencies of 1/30 (2.22 ± 0.01 mg/L) and 1/20 (2.21 ± 0.01 mg/L), which did not show a significant difference (P > 0.05). The least PO43- uptake (0.87 ± 0.09 mg/L) was observed at an agitation frequency of 1/1 moa/moo. In terms of percentage-based nutrient utilization, agitation at 1/10 moa/moo achieved the highest PO43- uptake (90.66 ± 0.00%) compared to other agitation frequencies (Figure 5b). Comparable PO43- absorption was observed at agitation frequencies of 1/30 (80.82 ± 0.28%) and 1/20 (80.66 ± 0.50%) moa/moo. At an agitation frequency of 1/1 moa/moo, PO43- assimilation was nearly three times lower (31.72 ± 3.27%) than at 1/10 moa/moo. The trend of significant differences aligned with the amount of PO43- uptake.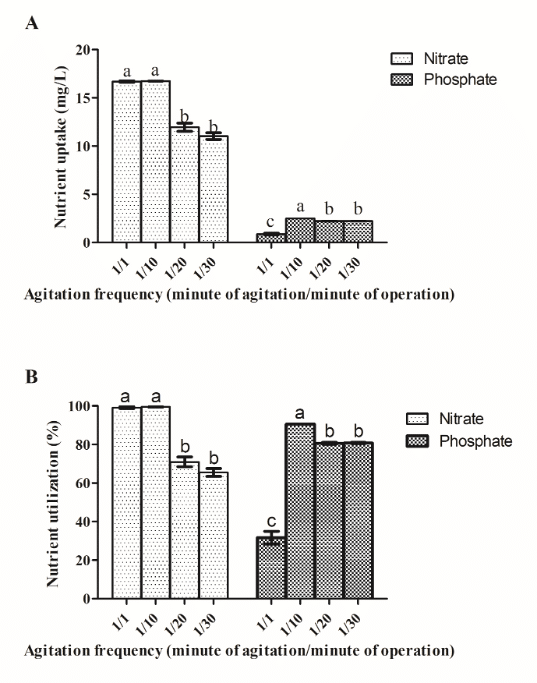
3.4 Agitation at 1/1 moa/moo exhibited smallest cell size
The maximum cell size of I. galbana increased proportionally with the agitation frequencies applied (Figure 6). The largest maximum cell size recorded was 38.77 ± 1.84 μm² at an agitation frequency of 1/30 moa/moo. This was followed by 1/20 (36.20 ± 1.66 μm²), 1/10 (35.14 ± 1.76 μm²), and finally 1/1 (33.40 ± 0.13 μm²) moa/moo. No significant differences (P > 0.05) in maximum cell size were observed among the various agitation frequencies.
No distinct pattern in the minimum cell size of this microalga was observed across various agitation frequencies. The agitation frequency of 1/30 moa/moo yielded the highest minimum cell size (14.39 ± 1.21 μm²). In contrast, both 1/1 (12.61 ± 0.72 μm²) and 1/20 (12.57 ± 1.64 μm²) moa/moo agitation frequencies produced similar minimum cell sizes. The lowest minimum cell size (10.90 ± 1.64 μm²) was recorded at an agitation frequency of 1/10 moa/moo. No significant differences (P > 0.05) were found in minimum cell size across the different agitation frequencies.
Similarly, no evident trend in mode cell size was identified for this microalga across various agitation frequencies. Agitation at 1/10 moa/moo resulted in the highest mode cell size (23.32 ± 2.43 μm²), which showed a significant difference (P < 0.05) compared to 1/1 moa/moo, but no significant difference (P > 0.05) when compared to 1/20 and 1/30 moa/moo. The lowest mode cell size (15.68 ± 0.52 μm²) was obtained at an agitation frequency of 1/1 moa/moo.
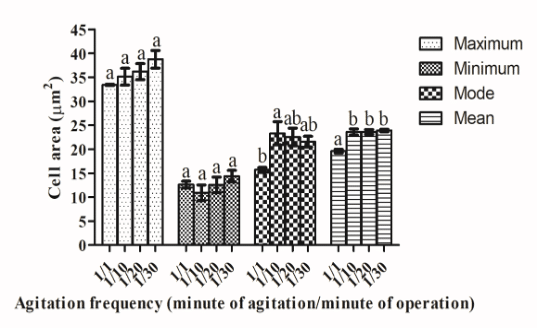
A similar trend in mean cell size was observed across various agitation frequencies, consistent with the maximum cell size. The highest mean cell size (23.89 ± 0.26 μm²) was recorded at an agitation frequency of 1/30 moa/moo, followed closely by 1/20 (23.59 ± 0.49 μm²) and 1/10 (23.59 ± 0.65 μm²). No significant differences (P > 0.05) were found in the mean cell sizes among these agitation frequencies. However, the mean cell size (19.60 ± 0.36 μm²) at an agitation frequency of 1/1 moa/moo was significantly lower (P < 0.05) than those at the other agitation frequencies.
4. Discussion
Agitation is essential for achieving high productivity in microalgal cultures. It enhances gas-liquid exchange, particularly by supplying carbon dioxide and removing oxygen, promotes homogeneous distribution of nutrients and temperature, and increases light exposure throughout the cell suspension. Insufficient agitation can lead to sedimentation, with sedimentation rates ranging from 0.1 to 2.6 cm/h under static conditions. This can result in cell death and decomposition, ultimately reducing yield and compromising product quality. Conversely, vigorous agitation can create high shear rates that may damage microalgal cells, although the extent of this damage varies depending on the characteristics of each species (de Souza Kirnev et al., 2022; Suh and Lee, 2003). Therefore, this study aimed to assess the impact of four different pneumatic agitation frequencies on the physiological properties of I. galbana.
The growth curves based on both cell number and biomass of I. galbana exhibited a similar pattern under different agitation frequencies, consistent with previously reported linear correlations between cell count and biomass (Lu et al., 2017). The complete growth phase of this microalga was observed only at 1/1 moa/moo, but not at any other frequencies. This can be explained by the fact that this agitation frequency accelerated the growth cycle of the microalga. The enhanced growth at 1/1 moa/moo is further evidenced by the rapid increase in both cell count and biomass from day 2 to day 8. Moreover, the microalga cultured under 1/1 moa/moo achieved the highest maximum cell count and biomass in the shortest period compared to other agitation frequencies, indicating that this frequency promotes superior growth. This enhanced growth was also supported by the greatest biomass productivity and specific growth rate (SGR) among all tested agitation frequencies. These improvements can be attributed to the continuous agitation at 1/1 moa/moo, which provides better gas exchange, reduces mutual shading and photo-inhibition, and enhances nutrient homogeneity (de Souza Kirnev et al., 2022). However, the maximum cell density and SGR of the microalga in this study are lower than those reported by Gómez-Loredo et al. (2016). This discrepancy may be due to the use of different aeration intensities, with a higher volumetric gas flow rate (vvm) employed in their study compared to the current study (0.42 vvm).
For intermittent agitation (1/10, 1/20, and 1/30 moa/moo), growth performance, measured by both cell density and biomass, was significantly lower (P<0.05) compared to continuous agitation. The sedimentation of microalgae requires time, which varies between species and is influenced by factors such as density, particle size, temperature, cell aging, light intensity, and duration (Al Hattab et al., 2015). This also applies to nutrients in the media and waste products from microalgae. Furthermore, intermittent agitation limits carbon input into the media (Gómez-Loredo et al., 2016), which could inhibit optimal growth of the microalga. Weak liquid movement, leading to poor mixing and mass transfer efficiency, is likely a major factor contributing to suboptimal growth performance under intermittent agitation (Doran, 2013). Therefore, achieving a steady state of adequate agitation, such as continuous agitation, is key to maximizing productivity by sustaining high biomass production through the generation of a uniform mix of cell suspension and preventing biological fouling (Holland and Dragavon, 2014; Koller, 2015).
On day 6, the photosynthetic efficiency (PE, Fv/Fm) of I. galbana under continuous agitation (1/1 moa/moo) was significantly higher (P<0.05) than that under intermittent agitation (1/10, 1/20, and 1/30 moa/moo). Similarly, the cell density of this microalga followed the same pattern. Since Fv/Fmrepresents the PE of photosystem II (PS II) and serves as an indicator of both the stress level in microalgae and the photochemical efficiency of PS II (Latowski et al., 2011), the higher Fv/Fm observed with continuous agitation demonstrates that this method promotes the photosynthetic activities of the microalga. Furthermore, continuous agitation did not induce stress in the microalgal cells, likely because it increased illumination to nearly all cells, thereby enhancing both the PE and cell density (Gómez-Loredo et al., 2016). In contrast, the lower Fv/Fm value associated with intermittent agitation may be attributed to incomplete mixing, which led to insufficient illumination for the microalgal cells.
On day 30, the photosynthetic efficiency (PE) under continuous agitation was significantly lower (P<0.05) compared to intermittent agitation. Conversely, the cell number produced with continuous agitation was at least 2.26 times higher. Light availability in microalgal culture depends on the cell density of the specific microalgae in the culture medium (Wong et al., 2016). As mentioned previously, continuous agitation promotes a high cell density of this microalga, subsequently leading to a critical cell density. When the cell density exceeds this critical threshold, light penetration becomes limited due to mutual shading or self-shading, which prevents microalgal cells farther from the illumination surface from receiving adequate light (Park and Lee, 2001). Consequently, a lower PE value was observed for continuous agitation due to the higher cell density. This phenomenon was also seen with intermittent agitation, although the effect on the PE value was less pronounced compared to continuous agitation, due to the lower total number of cells. Photoinhibition was not observed throughout the study, as only 50 µmol photons/m²/s were utilized. To improve light availability to microalgal cells, various strategies have been proposed, including regulating cell density, installing effective agitation systems for stirring cultures, and designing efficient light-harvesting photobioreactors (Sforza et al., 2012).
Nitrate uptake by I. galbana in terms of both amount and percentage is significantly higher (P<0.05) at agitation frequencies of 1/1 and 1/10 moa/moo compared to 1/20 and 1/30 moa/moo. Lau et al. (1995) reported that lower microalgal density results in decreased nitrogen removal efficiency. Therefore, the higher cell density achieved at 1/1 and 1/10 moa/moo likely accounts for the increased nitrate uptake observed at these agitation frequencies. Another possible explanation for the higher nitrate uptake is the improved nutrient mixing at these frequencies (Gómez-Loredo et al., 2016). The more readily available nutrients in the medium, due to increased mixing, facilitate the easier adsorption of nitrate by this microalga. Consequently, a greater amount and percentage of nitrate were absorbed by the microalga at agitation frequencies of 1/1 and 1/10 moa/moo. The nitrate uptake observed at these agitation frequencies in this study aligns with the findings of Alkhamis and Qin (2015).
I. galbana agitated at a ratio of 1/1 moa/moo absorbed the least amount and percentage of phosphate, showing a significant difference compared to other agitation frequencies. Microalgae can capture phosphorus through several mechanisms, primarily involving two key processes: extracellular adsorption and intracellular uptake (Xu et al., 2020). The pH of a solution can profoundly impact adsorption, as the surface charge of the adsorbent strongly influences the adsorption of charged ion species. At higher pH levels, the increased presence of hydroxyl ions in the solution can compete with NO3− and PO43− for sorbent sites. Furthermore, the sorbent surface becomes more negatively charged as the pH rises, leading to greater repulsion and reduced adsorption (Rashid et al., 2017). This is particularly relevant, as the pH of the microalgal culture in this study exceeded pH 9 (data not shown). Consequently, phosphate uptake rates decrease in alkaline environments (pH > 9). Nevertheless, the pH of all microalgal cultures in the current study surpassed pH 9, regardless of the agitation frequencies. Intermittent agitation (1/10, 1/20, and 1/30 moa/moo) exhibited significantly higher phosphate uptake (P<0.05) than continuous agitation. It is proposed that continuous agitation shortens the reaction time for I. galbana to absorb phosphate from the media, resulting in a lower amount of phosphate being utilized. Conversely, intermittent agitation provides a longer duration for this microalga to uptake phosphate, allowing it to assimilate a higher amount of phosphate (Fang et al., 2016).Overall, the cell size of I. galbana subjected to continuous agitation at 1/1 moa/moo was smaller compared to that under intermittent agitation. It has been reported that larger cell sizes in microalgae are attained without agitation (Leupold et al., 2013). Thus, it is postulated that continuous agitation leads to smaller cell sizes compared to intermittent agitation. Notably, the smaller cell size exhibited greater nitrate uptake than the larger cell size observed under intermittent agitation. This finding aligns with research conducted by Hein et al. (1995), who proposed that cells with smaller surface areas generally demonstrate better nutrient acquisition than those with larger surface areas. Furthermore, Turpin (1988) highlighted that the distinct variations in nitrogen kinetics between small and large algae are often attributed to size-specific differences in relative surface area. This is due to the necessity for inorganic nutrients to be transported across the surface to become accessible for metabolic processes within the algae. In this study, a higher PE value was identified in microalgal cells with smaller sizes (induced by continuous agitation) compared to those with larger sizes (caused by intermittent agitation). This result agrees with Agusti et al. (1994), who reported that the efficiency of photon capture per unit of biomass is greater in smaller algae than in larger ones, underscoring that resource acquisition is intrinsically dependent on cell size. The increased rate of resource acquisition among smaller algae facilitates elevated metabolic rates, as corroborated by observations of photosynthetic and respiratory rates in microalgae (Markager and Sand-Jensen, 1994). The combination of rapid resource capture and elevated metabolic rates may explain the superior growth rates observed in small algae with high surface areas compared to larger forms with lower surface areas (Nielsen and Jensen, 1990). This relationship is supported by the present study, which demonstrated high growth performance in microalgal cells with smaller sizes due to continuous agitation (1/1 moa/moo).
5. Conclusions
I. galbana subjected to continuous agitation (1/1 moa/moo) demonstrated superior growth performance compared to intermittent agitation regimes (1/10, 1/20, 1/30 moa/moo). This condition also resulted in a distinct physiological profile, marked by higher photosynthetic efficiency on day 6, followed by a decline by day 30, increased nitrate uptake, reduced phosphate assimilation, and smaller cell size. These observations suggest that continuous agitation can initially enhance metabolic activity and nutrient assimilation efficiency but may also lead to physiological stress or nutrient limitations over extended cultivation periods. The dynamic response of I. galbana under varying agitation frequencies offers critical insights into the balance between growth stimulation and cellular stress. Future studies should investigate long-term adaptive responses, agitation-induced metabolic shifts, and integrated nutrient delivery systems to refine agitation strategies. Such optimizations could enhance biomass yield and consistency, further supporting the commercial application of I. galbana in sustainable aquaculture systems.
Acknowledgements
Authors acknowledge the facilities provided by the Department of Aquaculture, Faculty of Agriculture, Universiti Putra Malaysia. Authors are grateful for laboratory staff and project administrator for providing all materials needed to conduct this study.
Funding information
This work was financially supported by the Japan Science and Technology Agency (JST)/Japan International Cooperation Agency (JICA), Science and Technology Research Partnership for Sustainable Development (SATREPS) through the project for Continuous Operation System for Microalgae Production Optimised for Sustainable Tropical Aquaculture (COSMOS), and the SATREPS-COSMOS Matching Fund from the Ministry of 391 Education Malaysia (MOE).
Data availability
The data generated from this study might be shared with a valid request from the corresponding author.
Informed consent statement
Not applicable.
Conflict of interest
The authors declare no conflict of interest.
Authors’ contribution
Conceptualization, methodology, formal analysis, investigation, data curation, and writing: Ashikin Afzan; conceptualization, validation, supervision, funding, writing—review and editing: Ikhsan Natrah, Mohamed Shariff, and Fatimah Yusoff. All authors critically reviewed the manuscript and agreed to submit final version of the manuscript.
